It’s no secret that people of color often bear the brunt of environmental health hazards in the United States, often in ways tied to where they live. But new research out of the University of Washington and the University of California at Berkeley suggest for the first time at the national level just how much discriminatory mortgage lending practices of the 1930s persistently affect patterns of inequitable exposure to pollution even today, across more than 200 American cities.
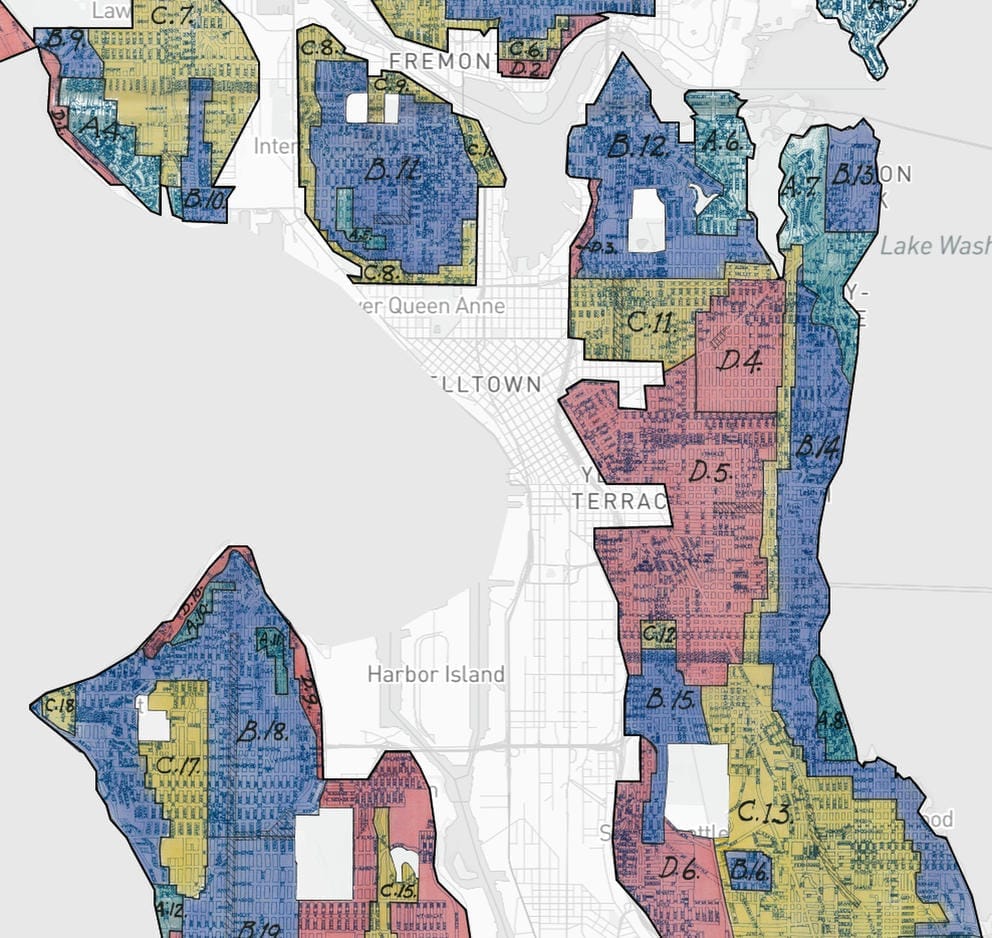
Efforts to increase home ownership after the Great Depression included policies such as the Home Owners’ Loan Act, a discriminatory mortgage appraisal framework. The act made it difficult for people from Black, Hispanic, Asian and other marginalized communities to purchase homes, especially in areas deemed desirable. The federal government, through the Home Owners' Loan Corporation (HOLC) graded areas of cities from most to least “hazardous” to inform mortgage eligibility, often because of who already lived there. Areas with large populations of color were overwhelmingly graded “D,” the lowest grade, and given red outlines on maps.
Redlining may have been outlawed in Seattle in 1968 and Washington state in 1977, but the UW and Berkeley study, published in Environmental Science & Technology Letters on March 9, 2022, shows that residents of Seattle, Tacoma and Spokane who live in areas previously assigned worse HOLC grades are exposed to greater levels of significant air pollutants on average than people living in better-graded sections of the same city. In Seattle, these neighborhoods include parts of the Central District, Beacon Hill and South Park, among others.
People in these neighborhoods also bear the brunt of other environmental hazards, including higher temperatures and less access to green space.
“When we look city by city, specifically in Washington state, we see many of the same disparities that match the national trends,” says study co-author Dr. Julian Marshall, a professor of environmental engineering at the University of Washington, and associate chair for Justice, Equity, Diversity, and Inclusion in the university’s Department of Civil & Environmental Engineering. “It affects us, and it affects every part of the U.S.”
“What the data tells us is that systemic racism still kills people in 2022, even though the people who laid the foundation of that racism … are already dead,” says Edwin Lindo, who is an associate teaching professor in the UW School of Medicine's Department of Family Medicine and assistant dean for social & health justice. Lindo, whose work includes teaching Critical Race Theory to physicians, medical students and trainees, is not affiliated with the study.

This federal redline map shows Seattle districts rated by desirability for the purposes of mortgage security. Neighborhoods like D4 (Central District) and D5 (International District, Judkins and Beacon Hill) were given the lowest grade and considered “hazardous” due to high populations of people of color. (Courtesy of Mapping Inequality)
Inspired by recently digitized national redlining maps out of the University of Richmond in Virginia, researchers at UC Berkeley and UW combined redlining and present pollution data to relate the enduring impacts of the former on the latter. While redlining wasn’t the only method of practicing housing discrimination and racial segregation, experts say it helped cement those patterns, informing where governments and businesses placed polluting infrastructure like highways and industrial facilities, as well as beneficial ones like parks. In Seattle, redlined areas are often closer to the industrial district and ports and rail lines, and today they are bisected by highways like Interstate 5; in Puget Sound, a dominant source of pollution is traffic exhaust.
Using the most recently available census data from 2010 and pollution data from that same year, the researchers overlaid HOLC grade maps to find a relationship between redlining and neighborhood exposure to nitrogen dioxide (NO2) and fine particulate matter (PM2.5), two pollutants associated with negative health outcomes. Together, the two claim more than 100,000 American lives annually. Nitrogen dioxide largely contributes to breathing difficulties and asthma, and PM2.5 is associated with stroke, lung cancer, heart attacks and more.
The relationship between HOLC grade and NO2 levels was pronounced, with areas receiving D grades exposed to 56% higher pollution levels nationally than their A counterparts. Nitrogen dioxide concentrations tend to be highest closer to where they’re emitted — places like highways — while PM2.5 can form in the atmosphere and spread out over larger areas of space, reducing local differences. Moreover, the places where people produce wood smoke from heating in Washington state (associated with PM2.5) aren’t always the same places where people experience traffic pollution, says Jill Schulte with the state Department of Ecology, complicating that pattern of exposure.

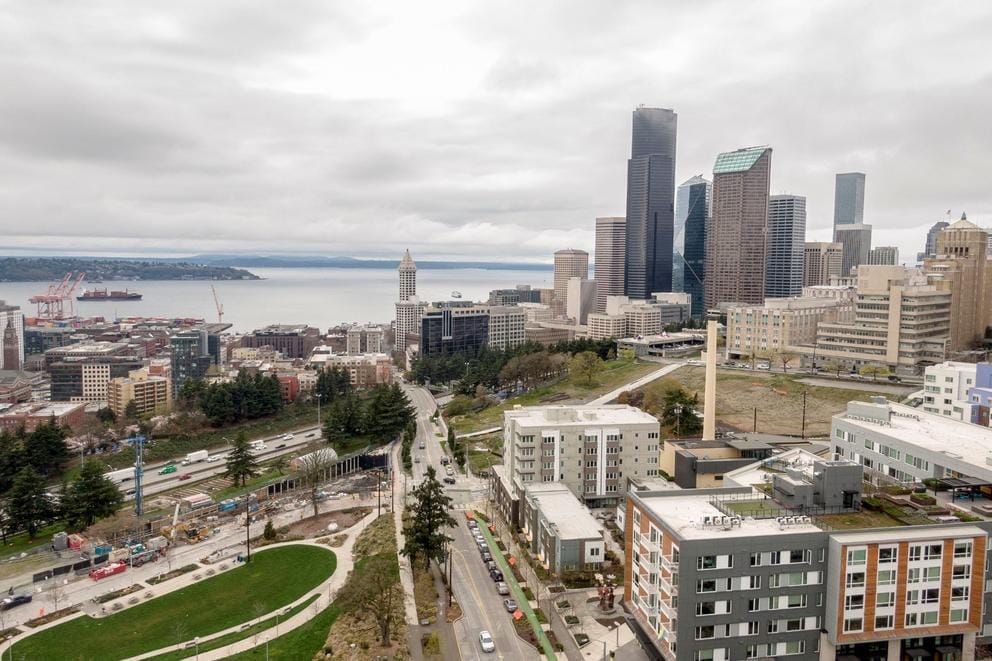
Yesler Way, seen looking east from near Yesler Terrace Park towards Cherry Hill and the Central District, in Seattle, Washington on March 28, 2022. The Central District was an area redlined due to its diverse population. (David Ryder for Crosscut)
In all three Washington cities that were studied, there was a general upward trend in pollution levels for nitrogen dioxide: Blocks graded A were clearly better off, and D blocks were worse off. In Seattle, there was slightly less pollution in C graded areas than B graded ones, which Marshall says could possibly be explained by infrastructure developments made after redlining.
“Our understanding of NO2 and PM2.5 here in Washington really fits with the fact that they found a very strong association for NO2 and a weaker one for PM 2.5,” Schulte says.
Not only did lower property values literally pave the way for highways, but wealthier neighborhoods had the means and time to oppose polluting infrastructure in their neighborhoods.
Dr. LaDale Winling, an associate professor of history at Virginia Tech who is not affiliated with the paper but helped digitize and curate the redlining map underlying it, says the HOLC grades institutionalized environmental hazards in areas rather than remediating them. “They basically said, ‘Don't invest here’ … and then locked those patterns in place over the course of many generations,” Winling says.
In addition to showing that areas with lower grades have greater levels of nitrogen dioxide than average in their respective cities, the research shows that the pollution level differences between HOLC graded areas is bigger than pollution level differences amongst racial and ethnic groups, in part because grades are tied to specific locations. But race and ethnicity do matter, especially at the local level. The research shows that, nationally, within each category grade, white people breathe cleaner air than their Black and brown neighbors who live within the same grades.
“In fact, the within-category differences among racial and ethnic groups are larger than the between-category differences,” Marshall says, representing another kind of racism.
Marshall and his colleagues found that in Washington cities, white people within a HOLC grade are generally exposed to lower levels of nitrogen dioxide pollution than are residents of color living in the same grade.
The paper doesn’t show why this is, but in addition to post-Home Owners’ Loan Act grade infrastructure changes, gentrification may also contribute: White people may live in redlined areas, but they might live in the least affected parts of them, or spend more of their time elsewhere.

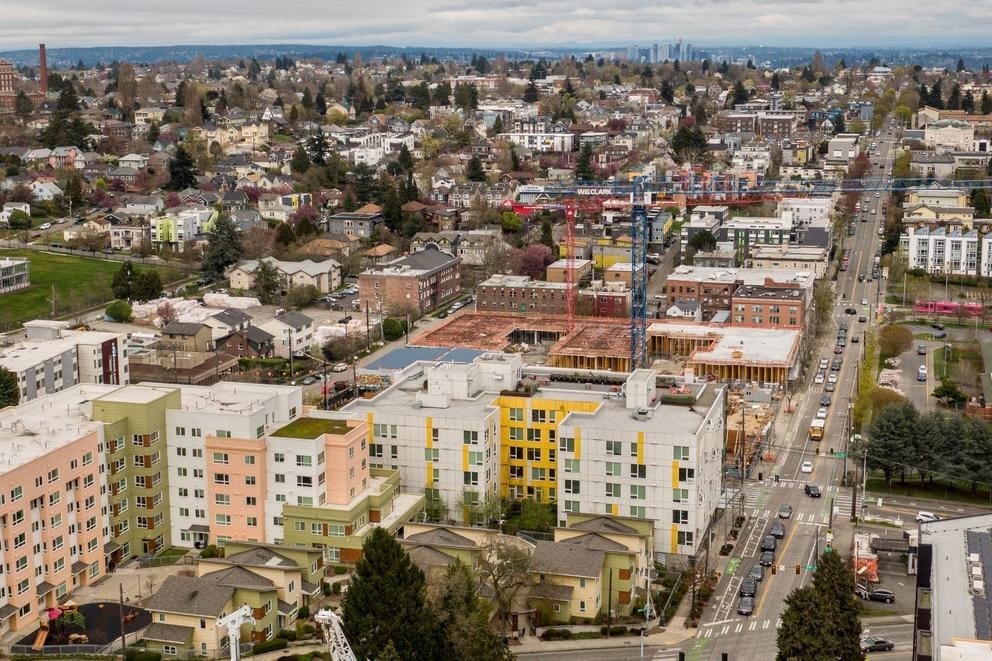
Areas east and southeast of downtown Seattle were redlined by the federal government’s Home Owners’ Loan Corporation in the 1930s. The neighborhoods, which were mainly inhabited by people of color, were given D grades that reflected mortgage security and were considered “hazardous” and “undesirable.” (David Ryder for Crosscut)
Researchers not affiliated with the work say it adds to our understanding of environmental racism. “This manuscript reaffirms what many communities of color already experienced for generations,” says fellow UW employee Dr. Esther Min, a clinical assistant professor in the department of environmental and occupational health sciences. The findings jibe with Min’s own work, which helped produce the Washington Environmental Health Disparities Map, a tool used by agencies from Ecology to the state Department of Health to target investments into those areas most affected by a number of environmental risk factors.
Dr. Vivek Shandas, a professor of climate adaptation at Portland State University who is not affiliated with the study, says the study adds to a growing body of research linking disinvestment and the siting of polluting infrastructure with inequitable health burdens. “The fact that these patterns exist is not new, though linking it to the redlining policy is helpful,” says Shandas, who has researched redlining’s relationship with other environmental hazards. “[It shows] few places are exempt from exposure to air pollutants.”
Shandas says it sounds correct that the study is, as the authors claim, the first full-scale examination of air pollution disparities relative to historical redlining in such a way that highlights its continuing effect on air pollution exposures in the United States. The study bridges disparate areas of research on a national level in a way that is compelling, he says, though it isn’t perfect. While weaknesses don’t invalidate that there is a relationship between redlining and present-day pollution, Shandas says the data being from 2010 dates the findings, and outdoor pollution does not account for what people are actually breathing, as people spend the majority of time indoors, among other things.
Kate Cole with Public Health — Seattle & King County says that because of the many things contributing to asthma, prevalence levels can be tough to use as proxies for air pollution. However, maps for the years 2015-2019 show that many of the Seattle neighborhoods with the greatest adult asthma prevalence were given lower HOLC grades.
Additionally, Winling says that while HOLC grades weren’t single-handedly responsible for rejected home loans or pollution, they reflect perspectives that influenced how cities developed over decades. “We cannot say that the maps are causative, but we can say that the maps are a lens on the way that city planners and civic leaders and bankers in the 1930s thought about and then planned for these neighborhoods throughout the rest of the 20th century,” he says.
On a practical level, the study adds fuel to the environmental justice movement.
“It's important … to be aware that the inequalities in air pollution exposure that we see today have their roots in part in racist planning from 80 years ago. That decisions by people who are no longer alive are still affecting us,” Marshall says.
It also alludes to one of the most complicated parts of addressing environmental racism: that solutions often follow data, rather than simply the testaments of those affected. “Some of what we're doing here is using an academic study and scholarship to show that this is systemic, and is consistent with the lived experience of many people. And, unfortunately, that's needed sometimes for that information to enter into the political process,” Marshall says.
And this research takes time. “Proving things takes a tremendous amount of work, but the harm is caused,” Lindo says. “This work is sorely needed, and we need to start listening to the people who are saying it even before the research comes out.”
Lindo presents on ways that redlining contributes to pollution, which in turn has medical ramifications. A few years ago, he says, he made an argument that redlining led to higher rates of respiratory disease in South Seattle, but received pushback when he couldn’t provide a supporting study. For better or worse, he says, this study means he now has validation. “I’m glad this study exists,” he says. “I will be using it in my presentations.”
Now that this data is in hand, Lindo says, it can’t be ignored.
“We can't allow our residents to live in polluted communities that were intentionally built to harm them. … We acknowledge redlining existed. We acknowledge the racist folks that implemented those policies. We acknowledge, now, the harm that it’s causing,” he says. “So now … there must be some form of reparation.”
Area professionals who work for regulatory, transportation and health-oriented agencies are alert to these and similar findings related to environmental racism.
“As this study shows, historic structural racism has led to disinvestment in many predominantly Black and brown communities, including in King County,” says Public Health’s Cole. “This correlation between structural racism — both historic and ongoing — and poor health outcomes is part of why King County and Public Health declared racism a public health crisis in 2020.”
“We certainly recognize the urgency” around environmental justice, says Alex Adams, senior manager of maritime environmental programs at the Port of Seattle. Studies like this, he says, are really helpful in not only showing how redlining manifests itself today, but also in guiding places like the Port as they “really strategically undo those policies into the future.”
Over the past two decades, says Graeme Carvlin of the Puget Sound Clean Air Agency, the Puget Sound overall has seen “pretty dramatic” pollution reduction. And programs focused on decarbonizing the region, such as switching to electric vehicles, could reduce traffic pollution near previously redlined neighborhoods. The Puget Sound Clean Air Agency has a program that funds efforts to scrap these pollution sources.
Carvlin and other air quality experts use tools like the agency’s Community Air Tool, the Environmental Protection Agency’s Environmental Justice screen and Washington state’s Health Disparities Map that Min helped create to identify who bears the brunt of pollution, and then build relationships with impacted communities to prioritize their concerns. By overlaying factors like race and income with pollution, “it’s pretty clear which areas have more air quality impacts, and it does overlap quite well with those redlined maps,” Carvlin said.
What pollution reduction measures don’t solve are harms already committed. The data hews to medical outcomes, especially asthma rates throughout King County.
“I had a constituent in 2020 die from asthma, a 12-year-old girl,” says state Rep. David Hackney, D-Tukwila. His 11th Legislative District includes redlined areas in Seattle, and communities adjacent to the Seattle-Tacoma International Airport. Air quality is something people should be marching about, he says: “They’re breathing this polluted air every day … [and] the very people that are experiencing these health impacts have less access to quality health care.”
“The hidden cost of racism,” says UW educator Lindo, “is that it then doubles up as a burden of having to pay to cure ourselves for the harm that we didn't cause.”


